10.단어 빈도분석과 Word Clouding
💡목표
- 머신러닝에서 많이 사용되는 패키지인 sklearn 중에 CountVectorizer를 이용해 DTM과 TDM자료 만들기
- DTM자료와 TDM 자료를 통해서 TF(Term Frequency)로 자료를 변환하고 wordcloud를 통해 시각화 해보기
1) dtm과 tdm 이란?
-
dtm = Document Term Matrix(문서 용어 행렬)
문서가 행에 오고 용어가 변수(열)에 오는 형태. -
tdm = Term Document Matrix(용어 문서 행렬)
문서가 열에오고 용어가 행에 오는 형태.
실습) 01. 패키지 불러오기
#pip install wordcloud                      #wordcloud에서 오류시에 #삭제하고 실행하기

import pandas as pd                         #데이터구조의 전반적인 처리하는 패키지
import sklearn
from sklearn.feature_extraction.text import CountVectorizer   #특징(단어)가 몇번 들어있는지
from wordcloud import WordCloud, STOPWORDS  #STOPWORDS 불용어처리
import matplotlib.pyplot as plt             #matplotlib.pyplot 그림을 그려주는 기본 패키지
import numpy as np                          #numpy 연산처리를 array로 하기 위한 패키지
실습)02. 데이터불러오기 및 DTM자료 만들기
data=pd.read_csv('wos_ai_.csv',encoding='utf-8').ABSTRACT   #ABSTRACT열만 불러오기
cv = CountVectorizer(max_features=100,stop_words='english')
- max_features 는 특성(단어)의 갯수를 지정해주는 것
- stop_words 는 불용어 처리를 영어로 한다는 것(한글은 아쉽게 없음)
dtm= cv.fit_transform(data) #100개의 자료를 셋던 cv 자료를 dtm 자료로 변환
dtm   #결과 : <119x100 sparse matrix of type '<class 'numpy.int64'>'
- 위에 max_features의 값을 300개로 준다면 dtm 결과는 119x300 으로 출력 됨.
- 추출하고 싶은 원하는 단어의 수를 max_features의 값에 입력해주면 됨.
[ DTM 자료 형태 ]
| 단어1 | 단어2 | 단어3 | |
|---|---|---|---|
| 문서1 | 2 | 3 | 4 |
| 문서2 | 4 | 1 | 0 |
| 총 | 6 | 4 | 4 |
[ TF 자료 형태 ]
| 단어1 | 6 |
|---|---|
| 단어2 | 4 |
| 단어3 | 4 |
- 현재 dtm 변수의 형태는 DTM 자료 형태와 같은데 실제로 텍스트분석을 위해선 TF 자료 형태로 변환할 필요가 있음.
실습)03. TF 만들기
words = cv.get_feature_names() #특성(단어)의 이름을 words에 저장
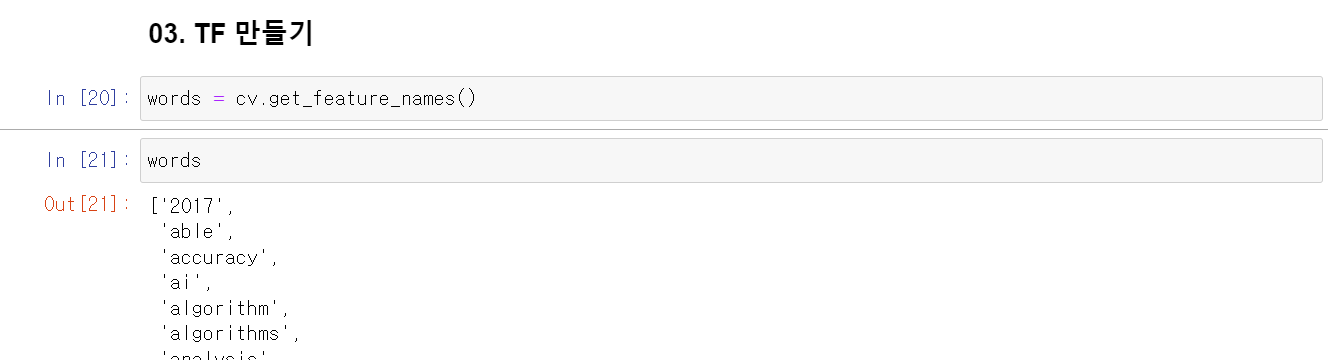
- words의 값을 실제로 살펴보면 algorithm 과 algorithms 은 어간이 같으므로 전처리 과정이 더 필요한 것을 알 수 있음.
- 이번 실습 때는 wordcloud 시각화가 목표이므로 전처리를 하지 않았지만, 텍스트분석 시에 전처리가 중요함.
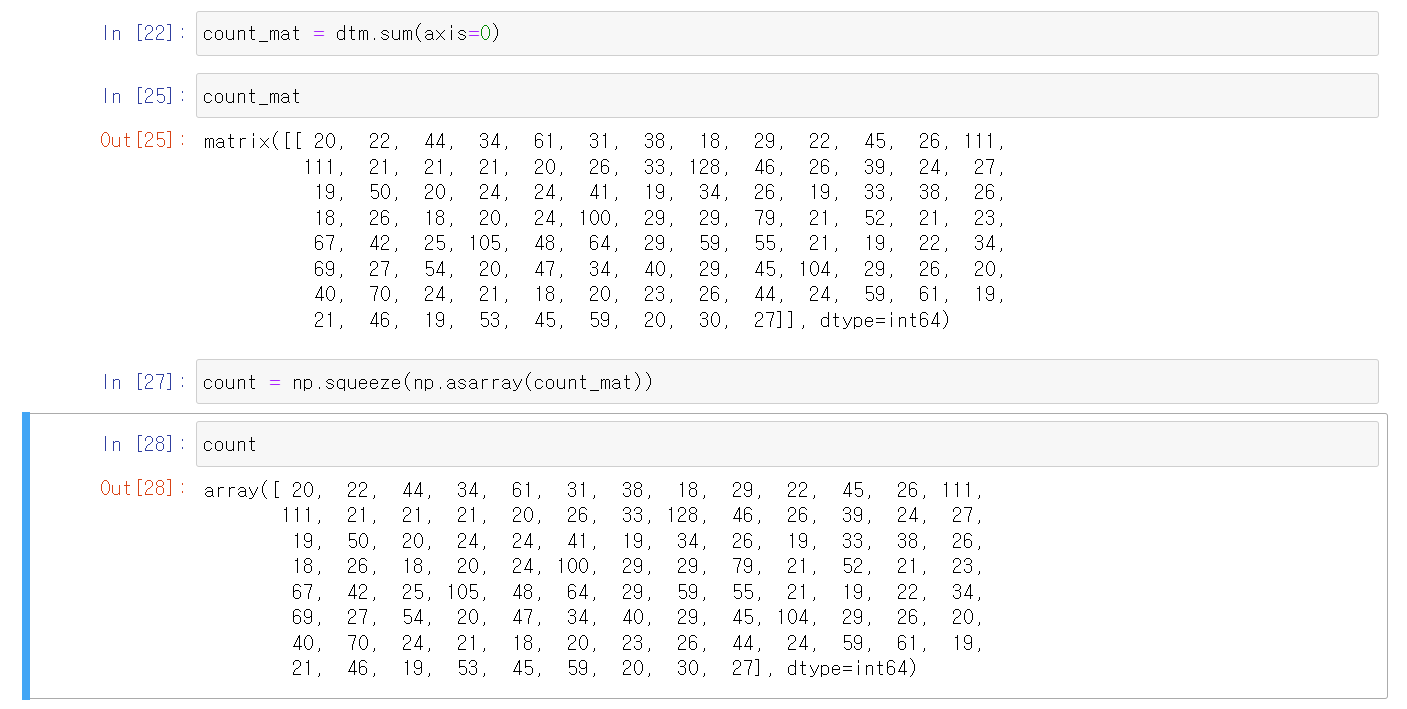
count_mat = dtm.sum(axis=0) #sum을 사용하려면 numpy 필요.
- dtm 자료를 열(세로)로 sum(더하기)하라.
- 행으로 더하려면 axis=1
- count_mat은 일때 matrix 형태로 출력된다.
count = np.squeeze(np.asarray(count_mat)) #array형태로 바꿔줌
- count변수를 위의 words 함수와 합쳐주기 위해 array 형태로 변환한다.
word_list=list(sip(words,count)) #count와 words 변수를 리스트로 합쳐줌
word_list
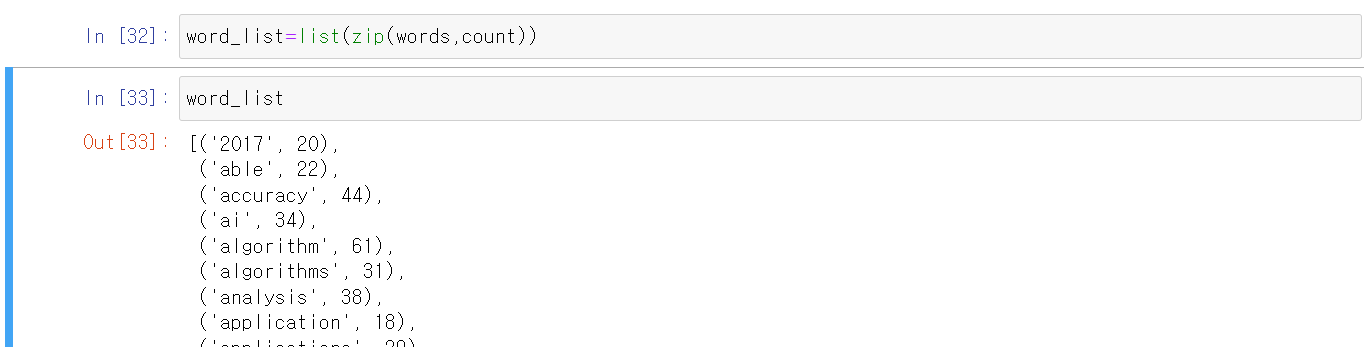
word_list=sorted(word_list,key=lambda x:x[1],reverse=True) # x[1] = count 를 기준으로 정렬
실습)04. WordCloud 그리기
stopwords= set(STOPWORDS)   # 불용어 저장
wc = WordCloud(background_color='black',stopwords=stopwords,width=800,height=600) #wordcloud 설정
cloud = wc.generate_from_frequencies(dict(word_list))  #wc(워드클라우드) 빈도는 word_list로 지정
plt.figure(figsize=(12,9))  # 그래프 크기 조정
- background_color = 워드클라우드의 배경색 지정
- stopwords = 불용어 지정(여기선 우리가 저장한 stopwords 변수 사용)
- figsize = 그래프 크기 조정
plt.imshow(cloud)  #그래프를 그려준다.
plt.axis('off')    #그래프의 축 없앤다.
- 실행 시에 안나오면 plt.show() 추가하기.

댓글남기기